
1. Why manual business reporting breaks down
Manual reporting usually starts small: one sheet, one person, twenty minutes a week. Then the business adds an ad channel, a second revenue stream and a CRM, and that twenty minutes becomes an afternoon of exporting CSVs, pasting ranges, fixing broken formulas and reconciling numbers that no longer match. The report still gets made, but three problems creep in.
- Time: the hours go into assembling the report, not acting on it.
- Consistency: KPI formulas drift as people copy tabs and "fix" calculations, so this month's number is not quite comparable to last month's.
- Fragility: the whole system lives in one person's head. When they are on holiday, the reporting is too.
Automation attacks all three at once: the data arrives on its own, the calculations are defined once, and the process runs whether or not anyone remembers it.
2. What Google Sheets can automate
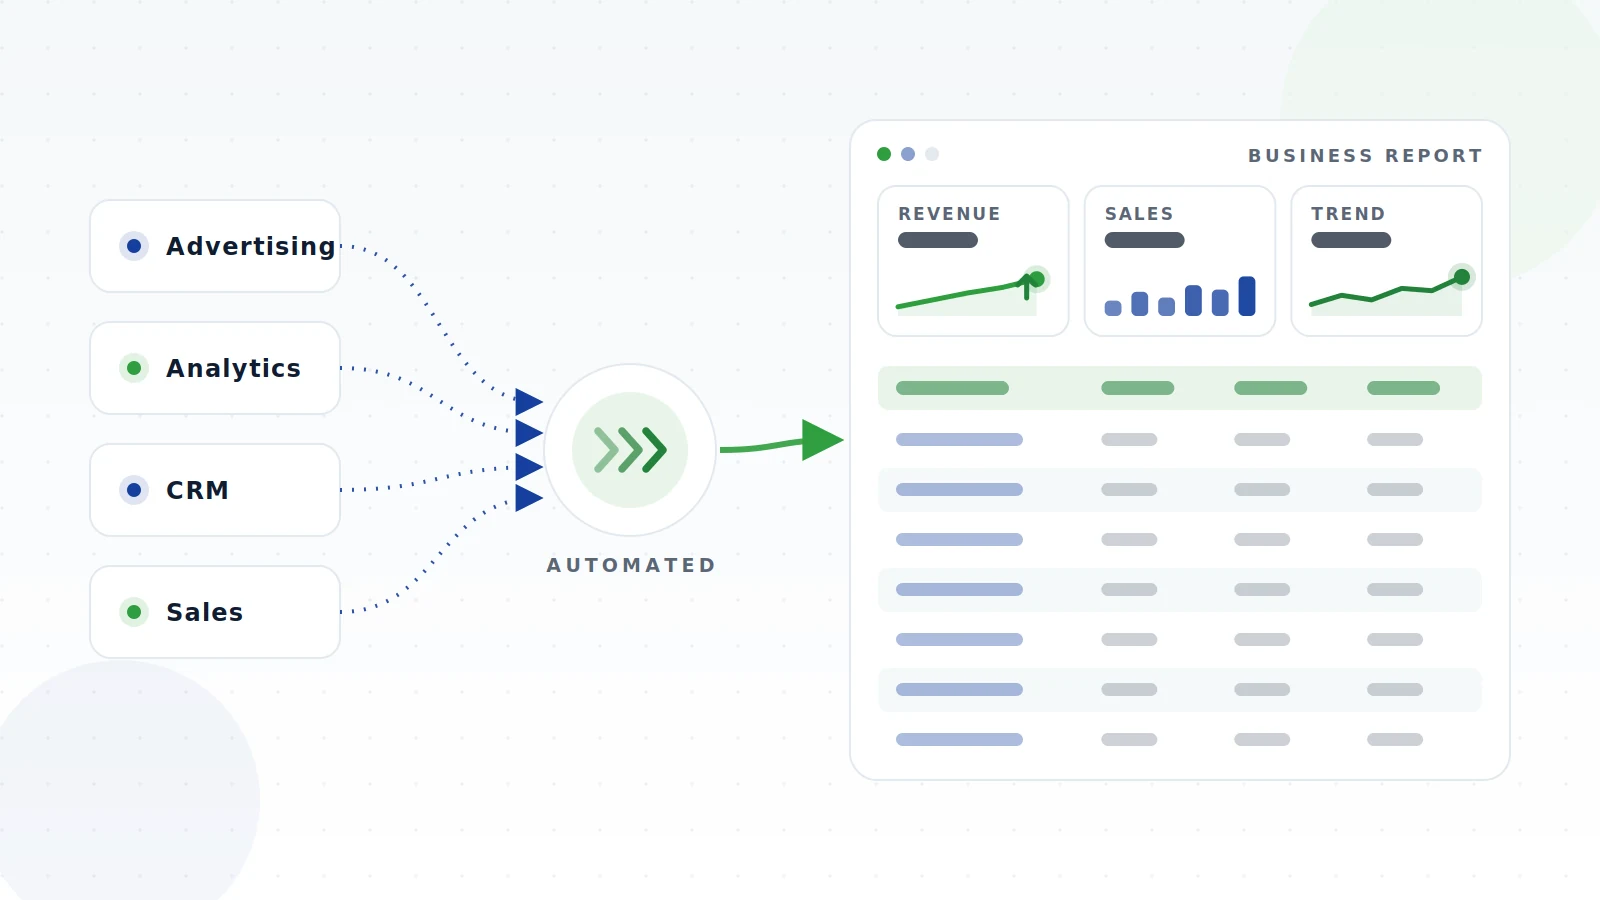
A surprising amount. A well-built automated sheet can receive fresh data on a schedule, clean and reshape it, recalculate KPIs, maintain a rolling history, and present a report tab that is always current. What Sheets automates well:
- Scheduled data imports from advertising, analytics, CRM, commerce and finance platforms
- Recurring calculations: totals, targets, period comparisons, running KPIs
- Report tabs that reformat the raw data into something management reads
- Historical snapshots, so trends survive even when source platforms only show recent data
The mechanics behind this are covered on our Google Sheets automation service page, and the same principles apply to Excel via spreadsheet automation generally.
3. Where the data comes from
Automated reporting is only as good as its inputs. Most businesses draw from a familiar set: advertising platforms like Google Ads and Meta Ads, analytics like Google Analytics 4, a CRM such as HubSpot, a store like Shopify or WooCommerce, payment data from Stripe, and finance tools like QuickBooks or Xero. Each can feed a sheet automatically instead of through exports.
The layer that moves this data reliably, on schedule, with retries and monitoring, is what we call data automation. Whether you build it yourself with connector tools or have it managed, the principle is the same: no human should be the pipeline.
4. Cleaning and transforming the data
Raw platform exports rarely agree with each other. One reports in your local currency, another in USD. One counts a conversion on click date, another on order date. Campaign names change halfway through a quarter. If you skip cleaning, your automated report will confidently display numbers that contradict each other.
Practical cleaning in a Sheets workflow means standardizing date ranges and timezones, mapping platform naming to your own categories, normalizing currencies, and keeping raw data on hidden tabs separate from calculation tabs, so a messy import never touches the report directly.
5. KPI calculations that stay consistent
Define each KPI once, in one place, and have every report reference that definition. A simple pattern that works: a raw tab per source, one combined tab that joins and cleans, a KPI tab where every metric is calculated, and a presentation tab that only displays. When someone asks how a number is calculated, the answer is a cell, not an argument.
6. Recurring updates without human hands
The finished system runs on a schedule: data lands overnight or hourly, calculations refresh, and the report tab is ready before the Monday meeting. The remaining human step is the one that matters, reading the report and deciding what to do. For weekly and monthly management reports, a dated snapshot tab or an exported PDF preserves what was reported when.
7. When to use Looker Studio instead
Sheets is ideal when people need to touch the numbers: annotate, model, build side calculations. When the goal is watching KPIs rather than working with them, a Looker Studio dashboard is often the better presentation layer: live charts, filters and sharing without anyone scrolling a grid. The two are not rivals; many businesses run Sheets as the engine and Looker Studio as the screen.
8. When managed reporting support makes sense
Everything above is buildable in-house, and for a simple stack it can be a good weekend project. Managed support starts making sense when the sources multiply, when the person who built the sheet becomes a single point of failure, or when broken connections keep stealing time from actual work. That is the gap our business reporting service fills: we build the system described in this guide, then monitor and maintain it, so the reporting stays accurate while your team stays on the business.
Prefer it done for you? Tell us which tools hold your data and what the weekly report should show. We build automated Google Sheets reporting and keep it running. Get started or see pricing.